MIBIscope™ Image Analysis
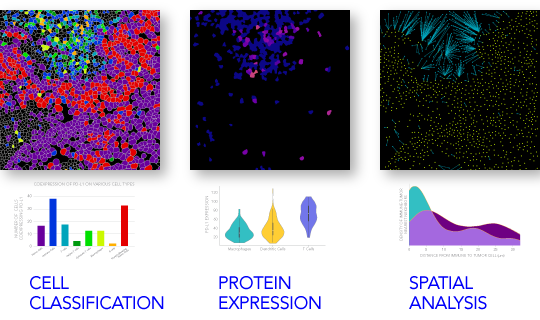
Examples of the types of analysis that can be performed to characterize the cellular behaviors and cell-cell interactions include: colocalization, single-cell analysis, and spatial analysis.
Ionpath also offers data analysis services performed by our expert MIBI bioinformatics team as part of our Ionpath Research Services.
Colocalization
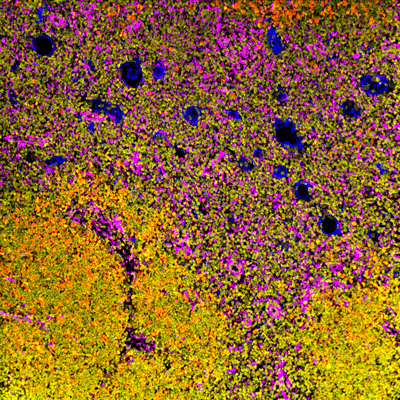
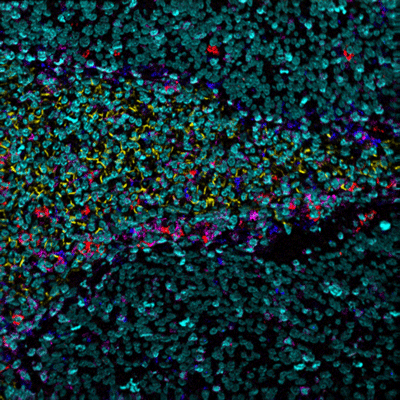
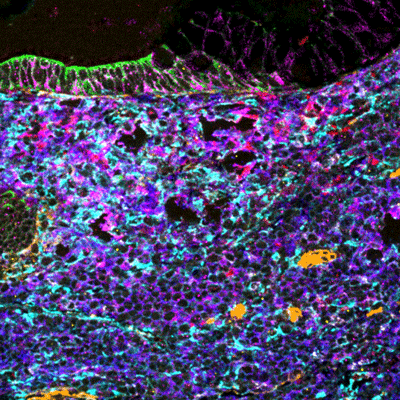
MIBIscope data can be used to simultaneously identify a multitude of cell subsets, such as T cells, NK cells, macrophages, other immune cell types, and cancer cells, all in a single image.
Examples of simultaneous imaging of immune, tumor, or stromal cell populations with key checkpoints and protein markers.
Single-cell Identification and Quantification
The true sub-cellular resolution that can be obtained with MIBIscope enables precise cell segmentation and enumeration of tissue immune cells with the latest imaging analysis algorithms.
In a recent paper published by Keren et al., single-cell analysis was performed with MIBI™ imaging data for 41 TNBC samples, illustrating a possible chronology of immune cell recruitment into the tumor.
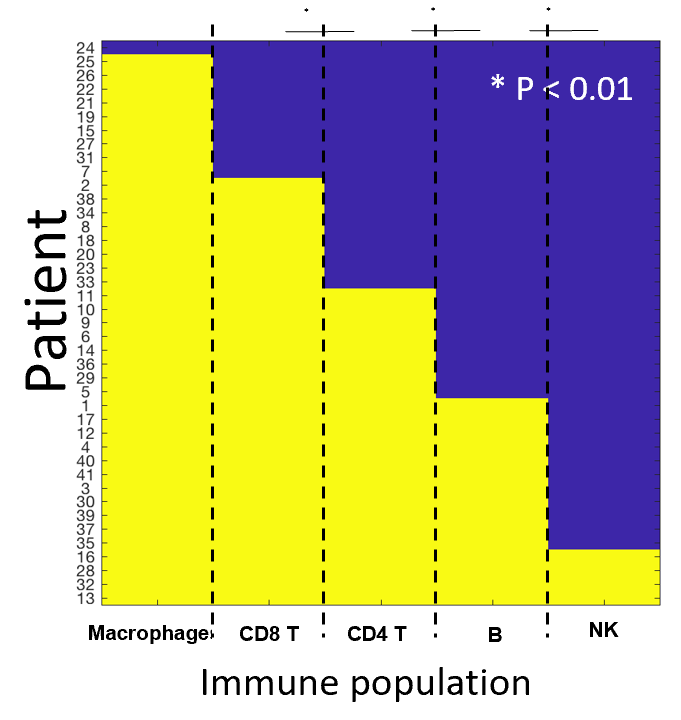
Each immune population was classified as either present or absent in the sample, and their co-occurrence was evaluated using a chi-square test. The authors found striking interdependence between the immune populations across patients. For example, all patients that had B cells also had CD4+ T cells and CD8+ T cells (X2 p < 0.005, p < 0.0001 respectively).
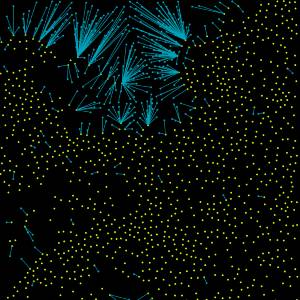
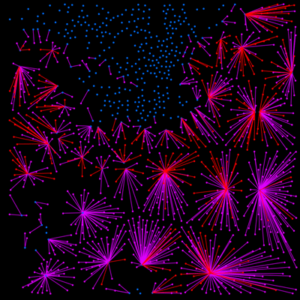
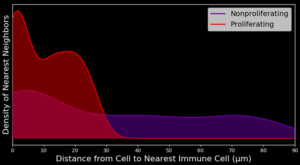
Spatial analysis: Phenotype Proximities & Immune Cell Mixing
Much of biology happens on the local level such that a cell’s nearest neighbors having large influences on cellular activities. This is especially true within the tumor microenvironment (TME) where the cellular composition may provide clinically actionable information to help guide patient treatment and disease classification. MIBIscope permits characterization of a wide range of cell populations within the TME and, more importantly, with their spatial relationships, including the degree of immune infiltration within a tumor.
